Imagine a file named mydata.dat similar to this:
0.000000    0.004976    1.000668    0.004659    1.002479
0.033333    0.405411    0.946623   -0.004262    0.962795
0.066667    0.741616    0.896441   -0.002820    0.933832
0.100000    0.955062    0.851992   -0.000545    0.910710
0.133333    0.989683    0.813224    0.001464    0.880583
0.166667    0.869582    0.772445   -0.002931    0.861828
0.200000    0.588769    0.739687   -0.000431    0.831633
0.233333    0.203916    0.707571    0.001057    0.813001
0.266667   -0.203938    0.675949   -0.003493    0.790597
0.300000   -0.582999    0.650786   -0.002432    0.769739
0.333333   -0.864435    0.619651    0.004778    0.754019
0.366667   -0.992943    0.596438   -0.000975    0.735994
0.400000   -0.954578    0.572505    0.002696    0.712679
0.433333   -0.746987    0.549953    0.003206    0.702145
0.466667   -0.404425    0.528155   -0.001252    0.681033
0.500000    0.000529    0.513741    0.004904    0.669130
0.533333    0.411274    0.486395    0.002340    0.654692
0.566667    0.747613    0.475256    0.003138    0.638884
0.600000    0.946674    0.456682    0.000977    0.621375
0.633333    0.995396    0.441643    0.003859    0.610283
0.666667    0.867722    0.428477    0.000037    0.597616
0.700000    0.583551    0.408982    0.000493    0.586991
0.733333    0.203063    0.402748    0.001209    0.579659
0.766667   -0.203376    0.383468   -0.001815    0.567006
0.800000   -0.592304    0.371587   -0.002840    0.551561
0.833333   -0.870292    0.361605   -0.000566    0.542538
0.866667   -0.993852    0.348607   -0.000797    0.534693
0.900000   -0.946291    0.345018   -0.004951    0.522615
0.933333   -0.747677    0.336688    0.001785    0.518061
0.966667   -0.404401    0.320089    0.003403    0.511825
1.000000    0.002465    0.318412    0.000288    0.501655
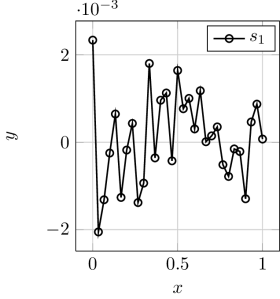
Data in a given column can be accessed using the corresponding command index. For instance, to plot the content in the first column on the x axis and the content of the third column in the y axis, one may write:
\begin{tikzpicture}
 \begin{axis}[
    grid=major,width=5.5cm,height=6cm,xlabel=$x$,ylabel=$y$,name=main]
  \addplot [color = black ,mark=o,thick,solid ]
            table[x index=0,y index=2]{mydata.dat};
  \addlegendentry{$s_1$}
 \end{axis}
\end{tikzpicture}
The result should look similar to this:

Note that the indexes start at 0.
Alternatively the command expr=\thisrowno{column_number} can be used to access data as in:
\begin{tikzpicture}
\begin{axis}[
grid=major,width=5.5cm,height=6cm,xlabel=$x$,ylabel=$y$,name=main]
\addplot [color = black ,mark=o,thick,solid ]
table[x index=0,y expr=\thisrowno{2}]{mydata.dat};
\addlegendentry{$s_1$}
\end{axis}
\end{tikzpicture}
This is specially useful to implement expressions that allow us to manipulate the data. For instance, imagine that we want to plot on the y axis the square of the data in the second column. To do that we use:
\begin{tikzpicture}
\begin{axis}[
grid=major,width=5.5cm,height=6cm,xlabel=$x$,ylabel=$y$,name=main]
\addplot [color = black ,mark=o,thick,solid ]
table[x index=0,y expr=\thisrowno{1}*\thisrowno{1}]{mydata.dat};
\addlegendentry{$s_1$}
\end{axis}
\end{tikzpicture}
Finally, if the columns of the file are identified using a header, one can access the data using the command expr=\thisrow{column_header}:
   X           Y1          Y2          C1         RR
0.000000    0.004976    1.000668    0.004659    1.002479
0.033333    0.405411    0.946623   -0.004262    0.962795
0.066667    0.741616    0.896441   -0.002820    0.933832
0.100000    0.955062    0.851992   -0.000545    0.910710
0.133333    0.989683    0.813224    0.001464    0.880583
0.166667    0.869582    0.772445   -0.002931    0.861828
0.200000    0.588769    0.739687   -0.000431    0.831633
0.233333    0.203916    0.707571    0.001057    0.813001
0.266667   -0.203938    0.675949   -0.003493    0.790597
0.300000   -0.582999    0.650786   -0.002432    0.769739
0.333333   -0.864435    0.619651    0.004778    0.754019
0.366667   -0.992943    0.596438   -0.000975    0.735994
0.400000   -0.954578    0.572505    0.002696    0.712679
0.433333   -0.746987    0.549953    0.003206    0.702145
0.466667   -0.404425    0.528155   -0.001252    0.681033
0.500000    0.000529    0.513741    0.004904    0.669130
0.533333    0.411274    0.486395    0.002340    0.654692
0.566667    0.747613    0.475256    0.003138    0.638884
0.600000    0.946674    0.456682    0.000977    0.621375
0.633333    0.995396    0.441643    0.003859    0.610283
0.666667    0.867722    0.428477    0.000037    0.597616
0.700000    0.583551    0.408982    0.000493    0.586991
0.733333    0.203063    0.402748    0.001209    0.579659
0.766667   -0.203376    0.383468   -0.001815    0.567006
0.800000   -0.592304    0.371587   -0.002840    0.551561
0.833333   -0.870292    0.361605   -0.000566    0.542538
0.866667   -0.993852    0.348607   -0.000797    0.534693
0.900000   -0.946291    0.345018   -0.004951    0.522615
0.933333   -0.747677    0.336688    0.001785    0.518061
0.966667   -0.404401    0.320089    0.003403    0.511825
1.000000    0.002465    0.318412    0.000288    0.501655
\begin{tikzpicture}
\begin{axis}[
grid=major,width=5.5cm,height=6cm,xlabel=$x$,ylabel=$y$,name=main]
\addplot [color = black ,mark=o,thick,solid ]
table[x index=0,y expr=\thisrow{C1}*\thisrow{RR}/2]{mydata.dat};
\addlegendentry{$s_1$}
\end{axis}
\end{tikzpicture}
The example above plots in the y axis the content in column C1 times data in column RR and divide the result by 2.
When the data file is relatively large, one may pick a data point every n+1 rows using the command each nth point=n. The result shown below is obtained after picking one data point every two rows. Compare the plot with the one at the top of the page.
\begin{tikzpicture}
\begin{axis}[
grid=major,width=5.5cm,height=6cm,xlabel=$x$,ylabel=$y$,name=main]
\addplot [color=black,mark=o,thick,solid]
table[each nth point=1,x index=0 ,y index=2]{mydata.dat};
\end{axis}
\end{tikzpicture}

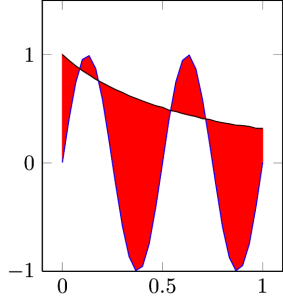
The following code shows how to trick tikz to fill the area between two curves:
\begin{tikzpicture}
\begin{axis}[width=5.5cm,height=6cm, stack plots=y,ymin=-1,ymax=1.5]
\addplot+[mark=none]table[x index=0,y expr=\thisrowno{1}]{mydata.dat};% \closedcycle;
\addplot+[mark=none,fill]table[x index=0,y expr=\thisrowno{2}-\thisrowno{1}]{mydata.dat} \closedcycle;
\end{axis}
\begin{axis}[width=5.5cm,height=6cm,ymin=-1,ymax=1.5]
\addplot[mark=none,black]table[x index=0,y expr=\thisrowno{2}]{mydata.dat};
\end{axis}
\end{tikzpicture}


